2.6 The model used in these notes
Apart from Okumura’s measured tints, every mixture in the rest of these notes is computed, not measured, and this lesson says how it is done and how far the results can be trusted. The model needs two numbers for each paint at every wavelength, how strongly it absorbs and how strongly it scatters, and it gets them in three steps before it mixes anything.
Read the masstone. Golden measured 78 of its Heavy Body acrylics in layers thick enough to hide the white card beneath them for all but the most transparent colors, and published the reflectance of each across the visible spectrum [24]. The model takes the surface reflection off with Saunderson’s correction (Section 2.2) and reads the paint’s \(K/S\) off the curve of Figure 8(c), one wavelength at a time. That ratio is not enough to mix with: two paints with the same masstone can mix quite differently if one scatters much more than the other, and a masstone cannot say how strongly a paint scatters.
Use a tint ladder. A tint ladder is a series of mixtures of one paint with more and more white. Every paint’s scattering is measured against the white’s, and in the paler tints the white does most of the scattering, so the tints show how strongly the paint absorbs; set beside the masstone’s ratio, that gives how strongly the paint scatters. Okumura, in Berns’s laboratory at RIT, painted and measured tint ladders for 26 Golden paints, using Golden’s Matte Fluid line, which has the same pigments as the Heavy Body paints [59]. The white in every ladder and every mixture is Golden’s titanium white, measured at the Rochester Institute of Technology [71].
Fit. Fitting means trying values for the unknown numbers until the model’s tints come out as close as possible to the measured ones. For each of the 26 paints the model tries a scattering strength, lets that scattering rise or fall smoothly across the spectrum, and nudges the absorption in the colors where the masstone sits on the surface floor and says nothing reliable. Five numbers per paint are adjusted this way until the computed ladder comes as close as it can to Okumura’s.
These 26 are the calibrated paints of the rest of the paper, and only they are mixed anywhere in it. The other 52, among them the cadmiums, cerulean blue deep and the cobalt greens, teal and turquoise, have no measured ladder and appear only as measured masstones; Table 1 marks which are which.
With each paint’s absorption and scattering in hand, a mixture is simple. Its absorption is the sum of its paints’ absorptions and its scattering the sum of their scatterings, each in proportion to the amount of paint by weight. This is Duncan’s two-constant form of the Kubelka–Munk law [22], named for the two numbers each paint brings at every wavelength. The mixture’s ratio goes back through the curve to give the reflectance inside the paint, the surface reflection is put back on top, and the result is what Golden’s instrument would have read. The color follows as in Part 1. The formulas and the fit are written out in the math box at the end of this lesson.
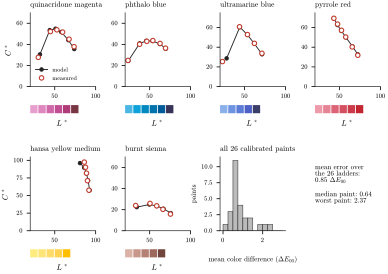
Figure 12. The model against measurement. For six paints, Okumura’s measured tints (open circles) and the model’s prediction for the same recipe (dots), plotted as chroma against lightness, with the model’s colors below [59]. The histogram counts the 26 calibrated paints by the model’s average error over each ladder, in units of color difference, where 1 is about the smallest difference a careful observer can see.
Set beside Okumura’s measurements in Figure 12, the model’s tints land on average within about one unit of color difference of the real ones. The worst paint, hansa yellow medium, is off by about two and a half, for a known reason: the ladder used for it is of Okumura’s Hansa Yellow Opaque, a different product with a lighter masstone. The transparent paints whose color rises and falls as white is added, such as quinacridone magenta and phthalo blue, come out with their peak in the right place and at the right height.
The model has limits too. Mixtures of two colored paints were never measured here, only tints with white. Okumura’s own test of his model on two-paint mixtures found an average error of about two units and eight at worst, for a translucent yellow mixed with ultramarine [59], and this model’s errors for such mixtures are probably of that order. Mixing is by weight of paint, as Okumura’s ladders were, so the proportions are not proportions of pigment, and a strong transparent paint goes much further per gram than a dense opaque one. The masstones of the most transparent paints were measured on films that do not quite hide the white card, so a little of the card shows through in their measurements.
Another weak point of the model is the shape of each paint’s scattering across the spectrum. Nobody measured it: the rise and fall that step 3 allows is whatever made the ladders come out right, and it is poorly pinned down in the colors a paint absorbs. For the phthalos and pyrrole red it makes the scattering climb steeply toward the deep red. The direction of that rise is real (Section 2.4); its size in the model, many times the white’s at the far red end, is not. In green light, by contrast, the phthalos scatter only about a hundredth as much as the white. The shapes should be read as what the ladders needed, and Parts 3 and 4 point back here where a result depends on them. The step-3 adjustments also shift the model’s masstones slightly away from the measured ones, for most paints by less than a unit of color difference and for ultramarine by about five, and the masstones quoted in Parts 3 and 4 are the model’s. Finally, the Kubelka–Munk law is itself an approximation (Section 2.3). None of this changes which way the effects go, and the figures say where a number is uncertain.
Sources
[22] D. R. Duncan, The colour of pigment mixtures, Proceedings of the Physical Society 52 (1940), 390–401.
[24] Golden Artist Colors, Inc., spectral reflectance data for 78 Heavy Body acrylics (10 mil wet drawdowns over a white Leneta card, D65, \(10\degree\) observer, 400–700 nm), published by A. Glassner and E. Haines, Golden Paint Spectra, https://www.realtimerendering.com/golden.html, 2025.
[25] Golden Artist Colors, Inc., Heavy Body Acrylics: Pigment Detail Chart, https://goldenartistcolors.com, 2025.
[51] M. Mohammadi and R. S. Berns, Verification of the Kubelka–Munk Turbid Media Theory for Artist Acrylic Paint, technical report, Munsell Color Science Laboratory, Rochester Institute of Technology, 2004.
[59] Y. Okumura, Developing a Spectral and Colorimetric Database of Artist Paint Materials, M.S. thesis, Rochester Institute of Technology, 2005, https://repository.rit.edu/theses/4892.
[71] L. A. Taplin and R. S. Berns, Art-SI Art Material Library: BYK-mac multi-angle spectral measurements, version 1.2, Munsell Color Science Laboratory, Rochester Institute of Technology, 2011.